
A data-driven mindset and an obsession with eCommerce metrics are crucial for online sellers. If you can’t measure it, you can’t improve it! Luckily for all of us in the eCommerce world, the nature of online transactions makes pretty much everything measurable.
Most high street retailers aren’t able to find out how many people enter and leave their shop, let alone what prompted them to come and their behavior once inside.
What eCommerce metrics should you measure on your website?
With an abundance of data, selecting what to measure is half the battle. Data overload can be confusing and unhelpful, so before we dive into the top eCommerce metrics let’s have a look at which metrics you should focus on to make your online store a sales generating machine!
The eCommerce sales funnel
The eCommerce sales funnel will help you to evaluate split eCommerce marketing metrics out into different stages.
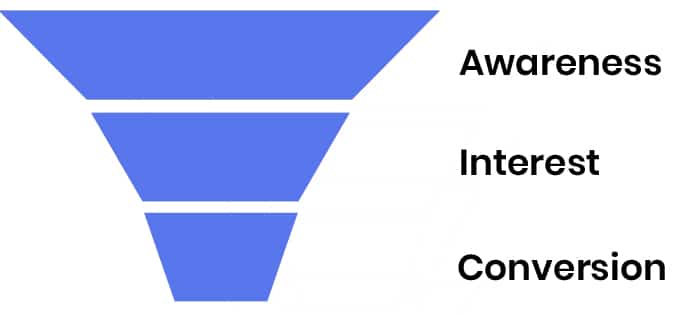
eCommerce metrics: Awareness
The first stage in the marketing sales funnel is all about how many relevant people are aware of your store. Needless to say, if people aren’t aware of your products they’re not going to buy them!
What are the best awareness stage eCommerce metrics to measure?
There are multiple awareness stage eCommerce metrics to measure depending on the advertising methods and channels that you’re using. For the purposes of this article, we’ll focus on the organic (non-paid channels) that you should measure on your website.
The awareness stage of your funnel doesn’t necessarily begin when they enter your site. Your site will be displayed on SERPs (Search Engine Results Pages) to people who are searching for things that Google thinks your site is relevant to.
The best way to gain metrics and useful data from this very high stage in your eCommerce funnel is with the Performance report on Google Search Console.
Google Search Console Performance Report
The performance report on Google Search Console is a flexible and intuitive way to measure your site’s performance and visibility.
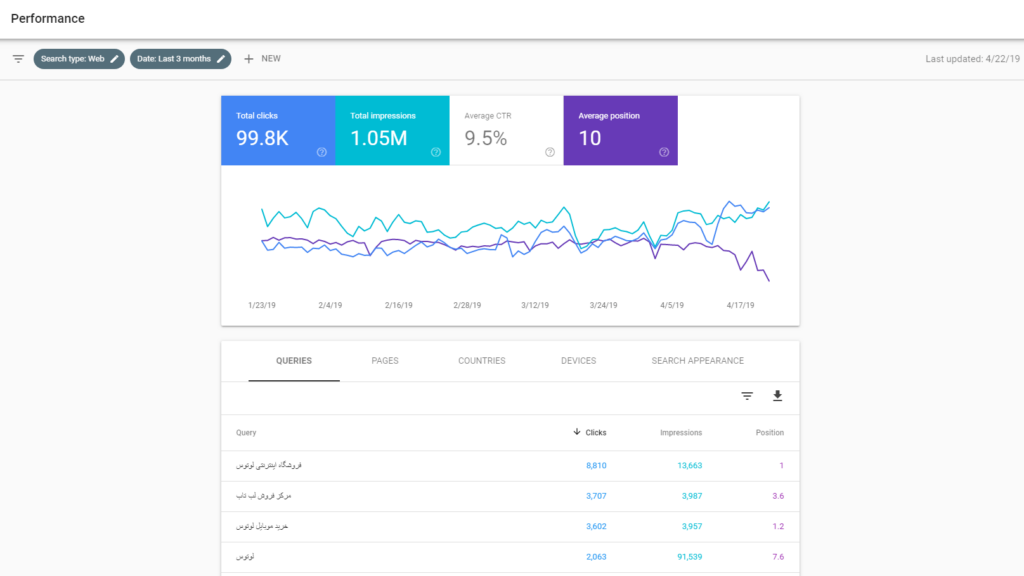
The top level metrics you can measure include:
- Total clicks: How many users clicked a link to your site. If a user clicks through to your site, clicks back and then through to your site again, this is counted as a single click.
- Impressions: This metric records the amount of times a user sees your link in a search result.
- Average Click through rate: The amount of impressions which resulted in a click.
- Average Position: The average position of your site when it appears in search results. There are complicating factors for this metric brought about by different types of search result. For instance; featured snippets, knowledge graph cards, carousels etc). You can find out more here.
The performance report on Google Search Console provides the opportunity to filter by criteria. This includes search query, pages, countries, devices, and search appearance and date range.
Awareness metrics on Google Analytics
Google Analytics enables you to gain detailed insight into your the onsite behavior of your eCommerce site visitors. It will give you insights on the whole of your funnel from the moment people arrive to the the thank you page they see after purchasing one of your items.
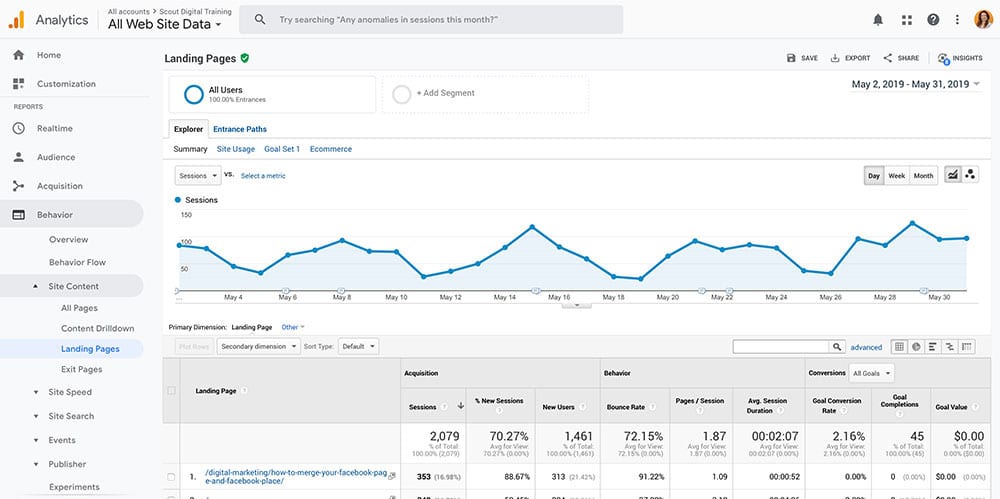
Regarding the top of the funnel ‘Awareness’ stage metrics, the Landing Page report is a good place to start. On the right hand navigation bar use the following path Behavior > Site Content > Landing pages.
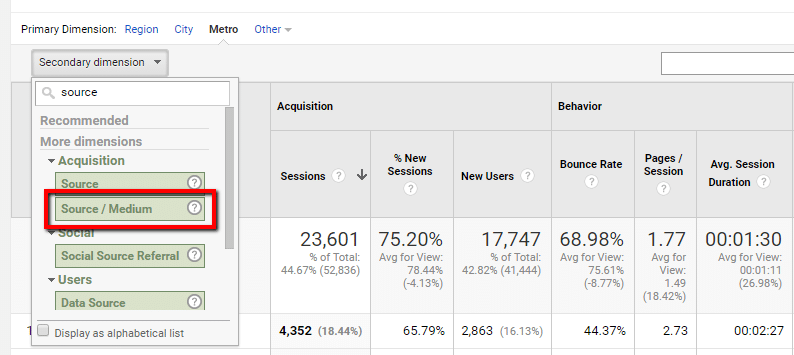
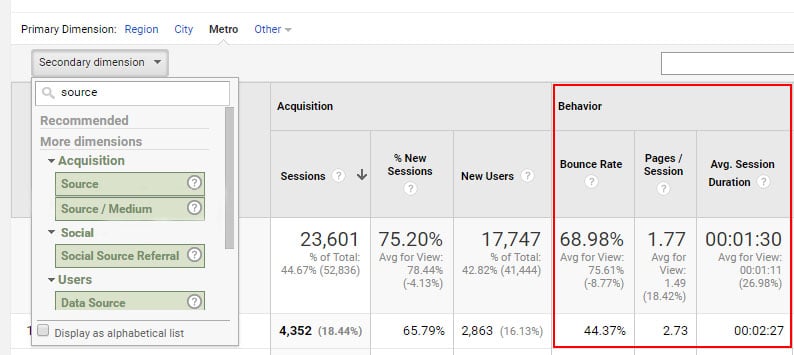
You can add a secondary dimension to this report which enables you to see where your users came from. This is important when evaluating the effectiveness of your marketing channels.
Click on Secondary Dimension > Acquisition > Source / Medium.
The report provides metrics that are relevant to the full funnel, from awareness right the way through to conversion. To begin with, let’s have a look at the metrics associated with the top of the eCommerce sales funnel:
- Session: a period when a user is actively engaged on your website. One session can include several pages views, conversions etc.
- % New sessions: The estimated percentage of first time sessions
- First time users: The number of first time users.
eCommerce metrics: Interest
The second stage in the eCommerce conversion funnel is interest. Sometimes referred to as ‘consideration’, this is the stage in the middle of the funnel in which you need to persuade a visitor to decide to purchase one of your products.
Using the same Landing Page report that was generated to get an indication of how many new users were entering the site and where they were coming from, we can get insight into their behavior as well.
[Source: Jeffalytics]
- Bounce rate (%): this measures the percentage amount of single page sessions. This means no links were clicked and no additional pages on your website were viewed. An engaged audience will correspond to a low bounce rate.
- Pages/Session: The average number of pages views in a session.
- Avg Session Duration: The average length of a session.
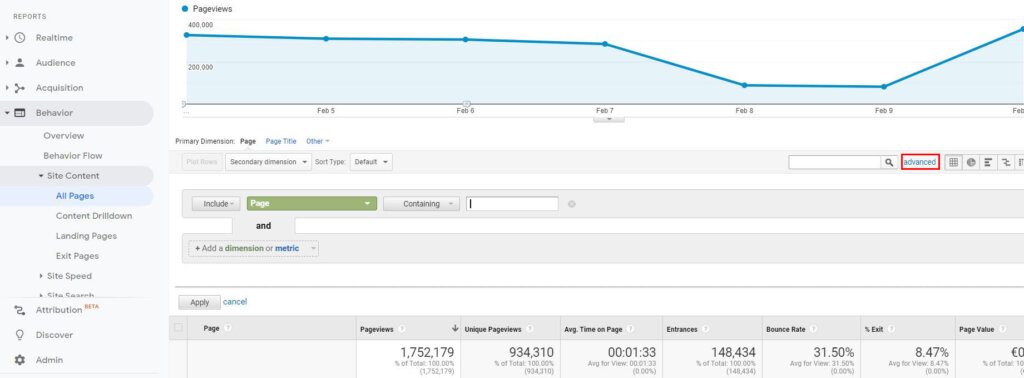
Product page views
Some pages on your site are more valuable than others. It’s better to have 1000 people check out your product pages (with ‘add to cart’ just one click away) than 1000 people read a blog article which is much higher in the eCommerce marketing funnel.
To check on specific product pages on your site you can create the report by going to Behavior > Site Content > All Pages. Then in the ‘advanced’ search filter you can specify which specific url – or set of urls – you’d like to analyze.
Behavior flow report
Another great way to analyze the interest stage of your eCommerce marketing funnel on Google analytics is the Behavior Flow report. This gives a holistic view of how your visitors navigate through your site, what event actions they take and where they drop off.
You can find it by navigating to Behavior > Site Content > Behavior Flow.
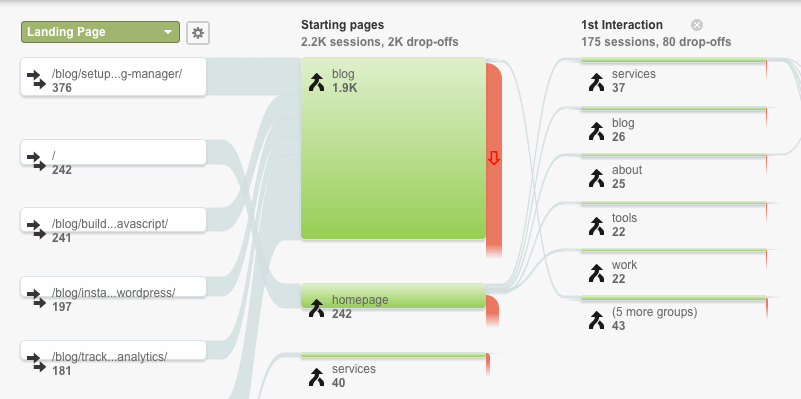
The Behavior Flow report is excellent for tracking how users move through your site, rather than evaluating each page in isolation.
This report should be used to gain insight alongside your Landing Page and All Pages report. None of these reports are necessarily better or worse than the others. Together they can give a high level of insight about the ‘interest’ stage of your eCommerce Sales Funnel.
eCommerce metrics: Conversion
Conversion is the part of the eCommerce marketing funnel that provides the most satisfaction, but can also be the most frustrating.
It’s a delicate stage in which you have to smoothly transition your potential customer from the shopping cart to the thank you page. Easier said than done!
The most important step to improving your conversion rates is to understand if you have a problem or not. The best way to do that is to focus on your eCommerce metrics and measure them constantly. This way if you increase your site visitors, you also increase your customers.
eCommerce conversions
Google Analytics has powerful capabilities when it comes to tracking eCommerce conversions. You can find out how to set up your website to track eCommerce goals here.
Once you’ve installed the correct code in the back end of your site, you can find them in the Goals > eCommerce section of Google analytics.
Conversions > eCommerce > Overview is where you can get a broad view of your conversion metrics.
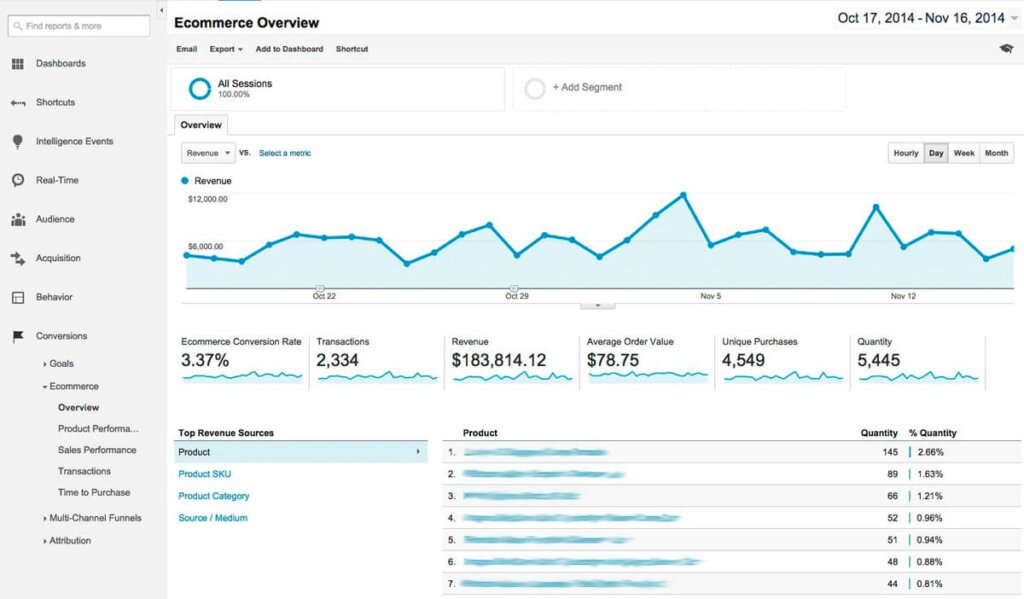
- Revenue: Total revenue from in-app transactions. Depending on how you’ve set up your tracking code, this could include tax and shipping.
- eCommerce Conversion Rate: this is where you can see how many sessions resulted in an eCommerce transaction as a percentage.
- Transactions: this metric is the total number of completed purchases on your site.
- Average order value: The average value of transactions.
This page will also give you a list of your top selling products and how they are split out by % of product revenue.
Shopping Behavior Analysis
This report is a helpful way of identifying leaks in your funnel where shoppers are dropping off. You’ll see how many people progress from a session to a cart addition, then to the check-out and transaction stages.
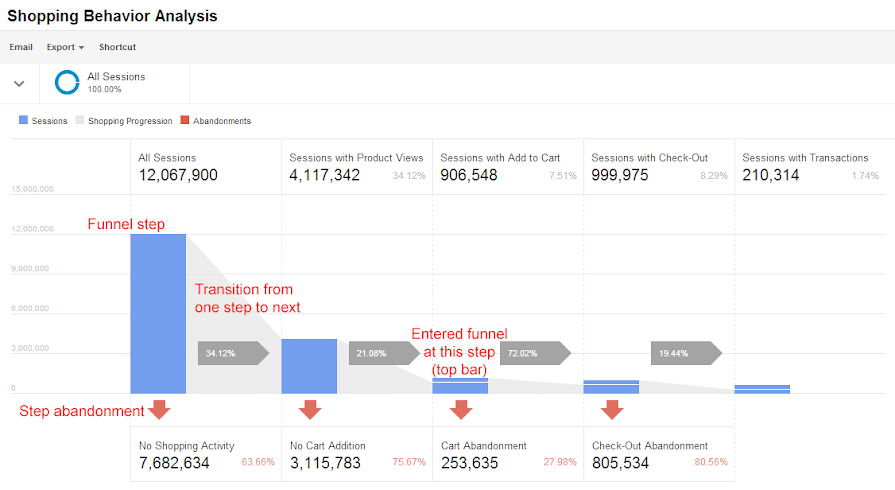
By tracking this metric over time, as well as referring to eCommerce benchmarks in your industry, you’ll be able to build a picture of the health of your funnel.
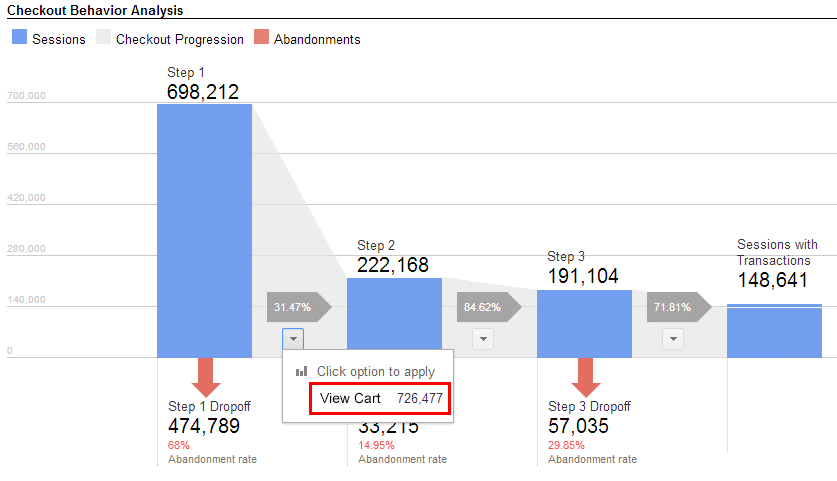
Checkout Behavior Analysis
The Checkout Behavior Analysis zooms in on the checkout process of your online store. Find it by navigating to Conversions > eCommerce > Checkout Behavior.
Product Performance Report
As you’d expect, this report enables you to measure the performance of individual products! This is a useful insight into which of your products are selling well and how they’re contributing to your sales total.
You can access it by navigating to Conversions > eCommerce > Product Performance.
The report provides a summary of basic sales performance metrics. These include product revenue, unique purchases, quantity, average price and average quantity, alongside shopping behavior insights which are:
- Cart to Detail Rate: The quantity of products added to cart over the amount of product detail views).
- Buy to Detail Rate: The quantity of products bought divided by the amount of product detail views.
This report is similar in structure to the ‘All pages’ report mentioned earlier, so you can also add a secondary dimension.
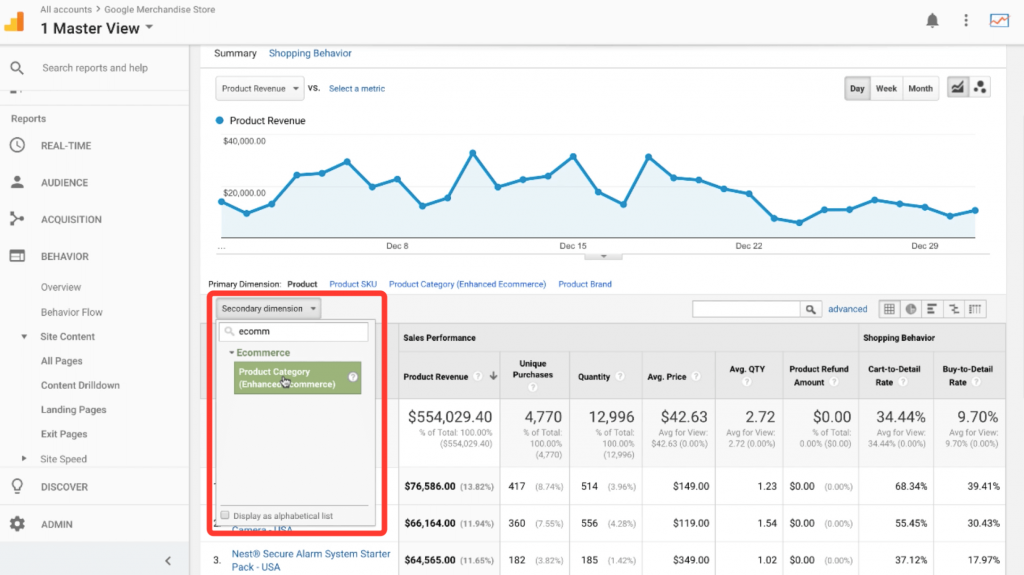
This is tremendously helpful when you’re looking to discover more granular detail about your sales. For example, the product category they belong to or where the buyers of specific products have come from (using the source / medium) dimension mentioned earlier in the article.
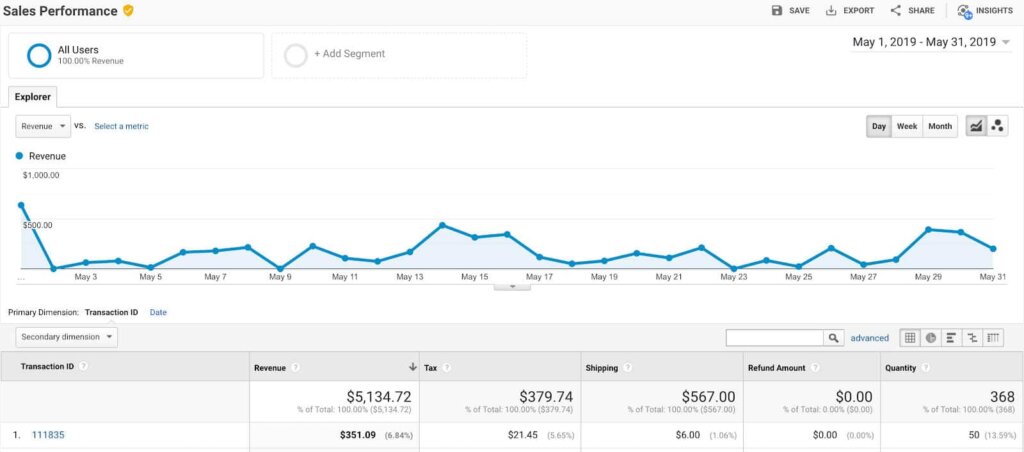
Sales Performance Report
The sales performance report is similar in structure to the Product Performance Report mentioned above. Instead of using the Product name, Product SKU, Product Category, or Product Brand as the primary dimension, you have the choice between Transaction ID and Date.
[Source: Vaimo]
The metrics that you’re able to measure in this report include:
- Revenue
- Tax
- Shipping
- Refund Amount
- Quantity
Product List Performance
This report enables you to create a group of products based on specified dimensions. There are three main ways to group product lists:
- Categories: This is the most straightforward list in terms of product groupings. It’s a static list which is grouped based on the categories of products you’re selling. So, for example, if you’re stationary shop you can compare your pencil sales with your paper sales.
- Search results: This creates a group based on the search query. For example, if a user searches for ‘vintage fashion’, all of the products that are shown will be added into a product list. This list is dynamic as the products shown could change over time.
- Related products: This dynamic list is suitable for measuring how products perform when featured in ‘customers who bought this also liked…’, blocks. You can also use this list for cross-sell and up-sell blocks to compare how products perform against each other.
Find out more about the Product List Performance here.
eCommerce metrics: final words
Effective use of eCommerce metrics is the best way online sellers can build on successes and overcome difficulties. They provide warning signs when a leak in the funnel is occurring and can flag the possibility of a sales boost for a particular product. If you use them to guide your decisions, your online store will flourish in no time!