State of eCommerce customer support 2026: eDesk benchmarks

This report sets out eCommerce customer service benchmarks drawn from a 30-day snapshot of eDesk platform data from thousands of sellers. It covers what customers contact sellers about, which channels those sellers run, and indicative ranges for response times, peak demand and automation potential. It's written for CX leads, founders and journalists who want first-party numbers from multichannel and marketplace sellers, rather than another round-up of other people's surveys.
TL;DR
Order status is a fifth of the queue. Order-status questions made up 19.2% of tickets in the snapshot, and post-sales support made up 29.2%.
Most demand arrives after checkout. Post-sales support, order status, returns and cancellations together accounted for 62.9% of tickets.
Sellers run several channels. 88% of eDesk customers connected Amazon in the snapshot and 57% connected eBay.
Ranges, not promises. Indicative first response runs 2 to 6 hours on average, and peak season adds an indicative 30 to 70% to ticket volume.
Key figures from the snapshot
Over 30 days, eDesk recorded 4,935,858 support tickets against 27,166,826 orders across its customers' connected channels.
Metric | 30-day snapshot of eDesk platform data |
| Support tickets | 4,935,858 |
| Orders represented | 27,166,826 |
| Customer conversations | 2,251,761 |
| Messages sent | 2,249,230 |
| Annual GMV represented | About $25bn, as reported by eDesk |
These counts come from thousands of eDesk customers selling across marketplaces, webstores and social channels. The methodology section below explains how a ticket, a conversation and a message are counted, and why the three numbers differ.
What customers contact sellers about
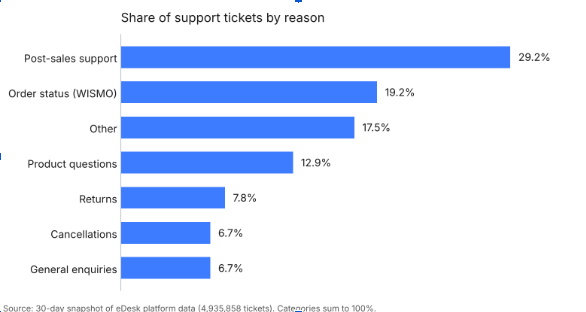
Post-sales support and order status are the two largest reasons customers get in touch, at 29.2% and 19.2% of tickets.
Share of support tickets by reason, 30-day snapshot of eDesk platform data
Category | Share of tickets |
| Post-sales support | 29.2% |
| Order status (WISMO) | 19.2% |
| Product questions | 12.9% |
| Returns | 7.8% |
| Cancellations | 6.7% |
| General enquiries | 6.7% |
| Other | 17.5% |
Source: 30-day snapshot of eDesk platform data.
Two groupings are worth reading together. Post-sales support plus order status comes to 48.4% of tickets. Add returns and cancellations and the total reaches 62.9%, which this report calls post-checkout demand: every ticket that arrives after the customer has paid.
That shape matters for planning. Most of the queue is about orders that already exist, so the answer usually sits in order, tracking or returns data rather than in a product page. Order status is the single most repeatable category, and our guide to automating WISMO inquiries covers how sellers take it off the queue.
Want to see how your own ticket mix compares, channel by channel? Book a Free Demo and we'll walk through your categories against these benchmarks.
Where eDesk customers sell
Amazon is the most connected channel among eDesk customers, at 88% in the snapshot, followed by eBay at 57% and Shopify at 31%.
Channel | Share of eDesk customers connecting it |
| Amazon | 88% |
| eBay | 57% |
| Shopify | 31% |
| Mirakl | 18% |
| Walmart | 17% |
| TikTok Shop | 9% |
| Cdiscount | 8% |
| WooCommerce | 5% |
| Magento | 5% |
| BigCommerce | 3% |
Source: 30-day snapshot of eDesk platform data. Shares add to more than 100% because most customers connect more than one channel.
These figures show reach only: how many eDesk customers connect each channel. They don't rank channels by support burden. eDesk records channel activity differently by platform (TikTok Shop chat-style messages can count as tickets, eBay and Mirakl include system-generated messages, and Amazon handles much of the support on FBA orders), so ticket counts by channel aren't a like-for-like comparison.
The multichannel picture is long-standing. A 2026 analysis of eDesk customers found that:
96.6% connected at least one marketplace
the median customer connected 17 channels
85% connected between 3 and 30 channels
Expando shows what that looks like in practice. The eCommerce services business supports more than 100 brands on marketplaces including Amazon, eBay and Allegro. Before eDesk, its team worked across 14+ support platforms. "Imagine logging into 14 different platforms just to check messages and notifications," said Ilona Medová, Head of Customer Success at Expando. In the Expando customer story, the company reports 14 platforms unified into one inbox, 1,300+ support channels managed centrally, 300+ daily messages and 33 languages supported via AI Translations.
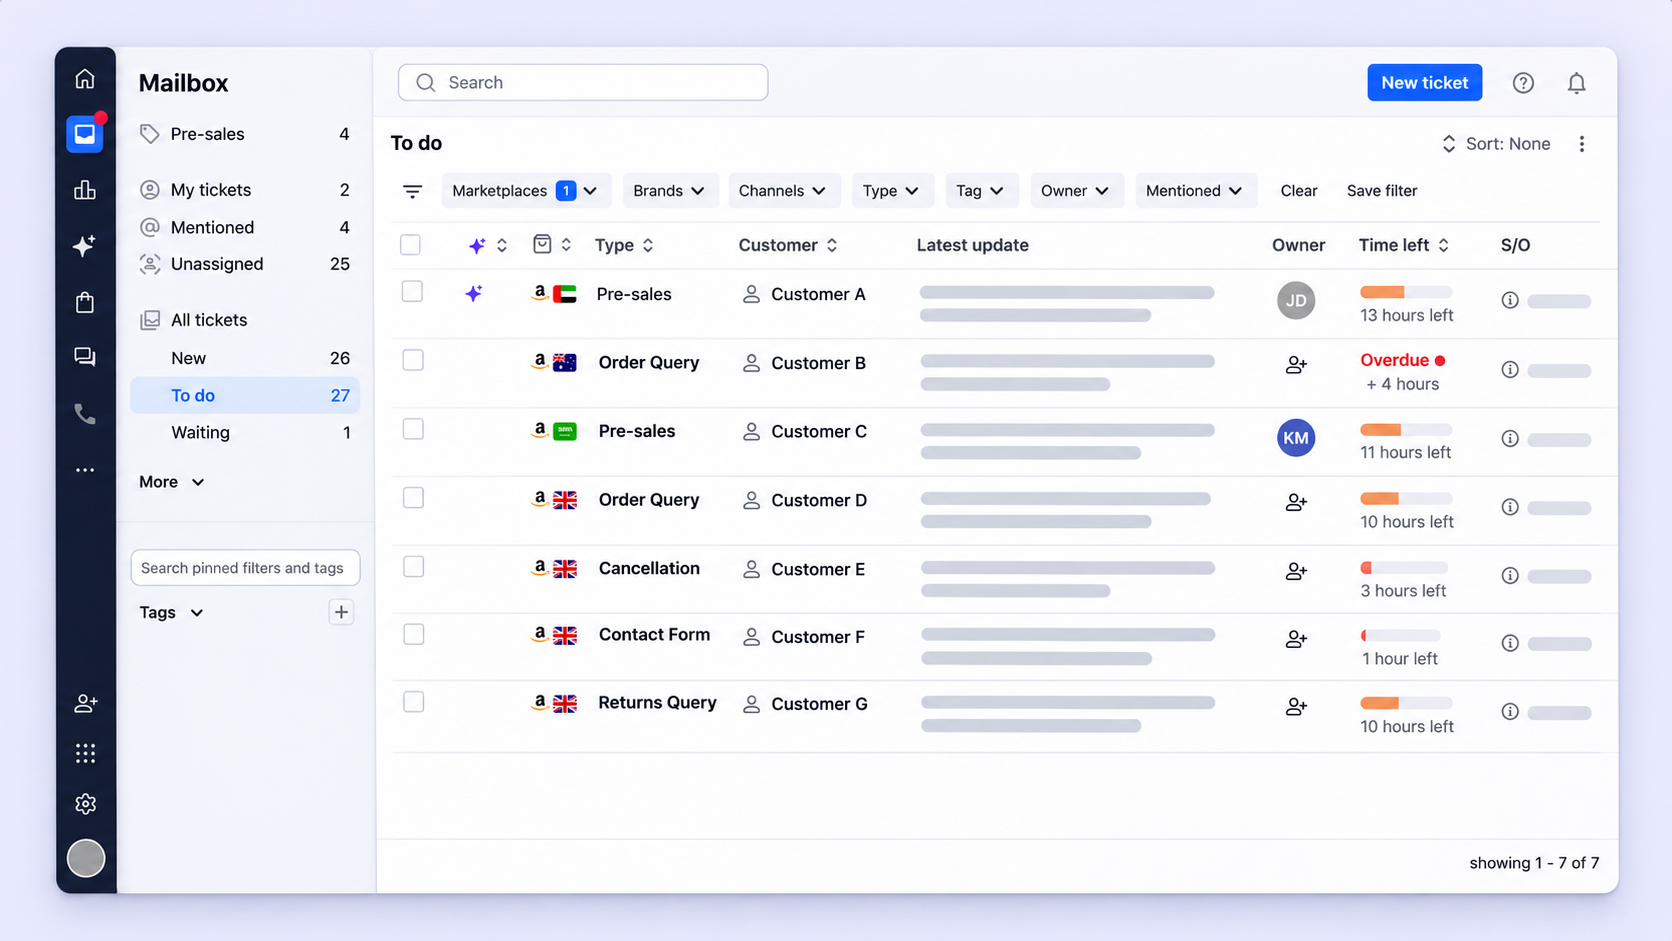 eDesk's marketplace support page lists the marketplaces it connects.
Indicative operating benchmarks
These are indicative ranges for planning, not measured averages, so treat each one as a starting point to test against your own data.
Benchmark | Indicative range | How to use it |
| Average first response | 2 to 6 hours | Compare your channel-by-channel average; if you sit above 6 hours, check routing and staffing at peak hours first. |
| Median first response | 45 to 90 minutes | Use the median alongside the average, since a few slow tickets can pull an average up. |
| Resolution time | 12 to 30 hours | Track it by category; returns and post-sales tickets usually take longer than order status. |
| Handle time | 7 to 10 minutes | Use it to estimate how many tickets one agent can close in a shift. |
| Conversations per agent per day | 35 to 55 | Use it to size headcount against expected daily volume. |
| Peak-season ticket increase | 30 to 70% | Plan staffing and automation for the top of the range, not the middle. |
| January rise in returns | 35 to 50% | Prepare returns replies and policies before the January wave arrives. |
Source: indicative ranges from eDesk platform data.
Returns are a wider retail pressure, too. The National Retail Federation and Happy Returns estimated that 19.3% of online sales would be returned in 2025, in their 2025 retail returns report.
Where AI fits
Order status has the highest indicative automation potential, at 80 to 95%, and the "other" category has the lowest, at 10 to 25%.
Category | Indicative automation potential |
| Order status | 80 to 95% |
| Returns | 60 to 80% |
| Cancellations | 60 to 85% |
| Product questions | 45 to 70% |
| Post-sales | 25 to 45% |
| General enquiries | 35 to 60% |
| Other | 10 to 25% |
Source: eDesk indicative estimates. These are potential, not measured outcomes.
Potential describes how much of a category could be automated where the relevant order, tracking, and returns data and workflows are connected. It isn't a result any seller is guaranteed to reach.
The measured figure is separate. For the average eDesk customer on AI Agent 3.0, 70% of the conversations the AI Agent replied to were resolved, based on eDesk's measurement of more than 11,000 live conversations (5 to 18 October 2026). eDesk counts a conversation as resolved when the customer didn't need to write back for 72 hours, or when the AI Agent completed the merchant's procedure. Source: AI Agent 3.0.
How to use these customer service benchmarks
Use the benchmarks to compare your own operation category by category and channel by channel, not as targets in themselves.
Map your own ticket mix. Tag a recent month of tickets into the seven categories above and compare your shares with the snapshot. A much higher order-status share usually points to tracking information customers can't find.
Set first-response targets per channel against marketplace rules. Start from each marketplace's own requirement, then set an internal target inside it. Walmart, for example, requires sellers to respond within 48 hours of receipt, weekends included, under its Customer Care policy.
Plan peak staffing. Illustrative example: a team handling 500 conversations a day at the indicative 35 to 55 conversations per agent needs about 10 to 15 agents. With a 30 to 70% peak increase, volume rises to 650 to 850 conversations a day, which needs about 12 to 25 agents on the same basis.
Choose what to automate first. Start where a high ticket share meets high indicative potential. Order status is both the second-largest category at 19.2% and the one with the highest potential, so it's usually the first workflow to automate.
Methodology and definitions
Every eDesk figure in this report comes from eDesk platform data and carries one of four labels: 30-day snapshot, 2026 analysis, indicative or potential.
Snapshot basis. The key figures, ticket mix and channel reach come from a 30-day snapshot of eDesk platform data across thousands of eDesk customers.
Ticket. In eDesk, tickets are used to organise and manage the customer messages a company receives or sends. Each message thread is stored in a ticket, and later messages on the same issue are grouped into that thread.
Conversation and message. These are eDesk's own platform counts of customer conversations and of messages sent over the same 30 days. They are counted separately from tickets, which is why the three totals differ.
Channel activity. Channel figures are activity recorded in eDesk, not like-for-like customer issues. TikTok Shop chat-style messages can be counted as tickets. eBay and Mirakl include system-generated messages. On Amazon FBA orders, Amazon may handle support rather than the seller.
Labels. "2026 analysis" marks figures from an earlier analysis of eDesk customers. "Indicative" marks planning ranges, not measured averages. "Potential" marks automation estimates, not measured outcomes.
Approval. eDesk's CEO approved these figures for use.
Key takeaways
Post-checkout demand (post-sales support, order status, returns and cancellations) accounted for 62.9% of tickets in the 30-day snapshot.
Order status alone made up 19.2% of tickets and carries the highest indicative automation potential, at 80 to 95%.
88% of eDesk customers connected Amazon and 57% connected eBay; channel figures show reach, not support burden.
Indicative ranges put average first response at 2 to 6 hours and peak-season ticket increases at 30 to 70%.
AI Agent 3.0 resolved 70% of the conversations it replied to for the average eDesk customer (eDesk data, October 2026).
Frequently asked questions
1. What share of eCommerce support tickets are about order status?
Order status made up 19.2% of support tickets in a 30-day snapshot of eDesk platform data. That makes it the second-largest category after post-sales support, at 29.2%. Together, the two accounted for 48.4% of tickets.
2. How quickly should an eCommerce team reply?
Indicative ranges from eDesk data put average first response at 2 to 6 hours, with a median of 45 to 90 minutes. Marketplace rules set the outer limit: Walmart requires sellers to respond within 48 hours of receipt, weekends included. Set your internal target inside each marketplace's rule.
3. How much does ticket volume rise in peak season?
Ticket volume rises by an indicative 30 to 70% in peak season, based on eDesk data. Returns then rise by an indicative 35 to 50% in January. Plan for the top of each range.
4. How much eCommerce support can AI handle?
For the average eDesk customer on AI Agent 3.0, 70% of the conversations the AI Agent replied to were resolved (eDesk data, October 2026). Indicative automation potential varies by category, from 80 to 95% for order status to 10 to 25% for "other" tickets. Potential is an estimate, not a measured result.
5. How was this data collected?
The data comes from a 30-day snapshot of eDesk platform data across thousands of eDesk customers. Multichannel figures come from a 2026 analysis, operating ranges are indicative, and automation figures are potential. Channel figures reflect activity recorded in eDesk, not like-for-like customer issues.
Benchmark your own support
Benchmarking your own support starts with the same steps used here: tag your ticket mix, measure first response by channel and plan for the top of the peak range. eDesk's free support scorecard gives you a 100-point audit of your current set-up to compare against these customer service benchmarks.
See how your own tickets, channels and response times look in one place: Start for free with a 14-day full-feature trial, no credit card required.
Author:
