Si eres un profesional de la atención al cliente, tu prioridad número uno es ofrecer una experiencia excelente al cliente. Pero incluso si crees que estás ganando en experiencia del cliente, es esencial que establezcas algunos indicadores clave de rendimiento (KPI) formalizados para que tus pruebas no sean sólo anecdóticas.
Utilizar las métricas de experiencia del cliente adecuadas te proporcionará la información que necesitas para asegurarte de que tú y tu equipo ofrecéis la mejor experiencia del cliente posible, trimestre tras trimestre. Al fin y al cabo, los objetivos son para medirlos…. y superarlos.
Aquí tienes 11 métricas clave de la experiencia del cliente de comercio electrónico que deberías seguir. Pero antes:
¿Qué son las métricas de la experiencia del cliente?
Las métricas de la experiencia del cliente son las estadísticas, datos y métricas que te dan una visión cuantitativa de cómo funciona tu empresa en términos de experiencia del cliente.
Es estupendo tener clientes que dejan a tu empresa críticas elogiosas, pero son los datos, los números duros, los que realmente cuentan la historia completa de si tu estrategia de atención al cliente está funcionando o no.
¿Cómo mides la experiencia del cliente?
Hoy en día, la mayoría de las plataformas de experiencia del cliente ofrecen métricas, lo cual es muy útil, pero aún así tienes que saber cómo leer las métricas. También debes comprender qué métricas son importantes para tu negocio.
Para identificar las métricas de la experiencia del cliente más importantes para tu empresa, tendrás que trazar un mapa de la USP (propuesta única de venta) de tu empresa. ¿Por qué es conocida tu empresa? ¿Y tu experiencia de cliente lo refleja?
A la hora de medir el rendimiento de tu empresa en cuanto a experiencia del cliente, tendrás que establecer unos estándares elevados (a veces conocidos como «objetivos ambiciosos») para tu programa de experiencia del cliente, y luego medir tu rendimiento con respecto a los puntos de referencia establecidos.
¿Qué son los KPI para la Experiencia del Cliente?

Lo primero que hay que entender sobre los KPI (indicadores clave de rendimiento) de la experiencia del cliente es que no existe un conjunto de KPI de talla única, porque variarán en función de tu tipo de empresa y de lo que ésta pretenda conseguir.
Las métricas de la experiencia del cliente que son casi universales incluyen:
- Tiempo de primera respuesta
- Tiempo medio hasta la resolución
- Satisfacción del cliente
Todos ellos son muy importantes para todas las empresas y todos los sectores. Sin embargo, para profundizar más, tendrás que examinar más ampliamente los objetivos que tu empresa intenta alcanzar y si tus métricas de experiencia del cliente apoyan ese objetivo.
Los KPI más profundos que una empresa podría medir, en función de su objetivo más amplio, podrían ser:
- Volumen de solicitudes de clientes
- Número medio de respuestas por solicitud
- Tasa de resolución
- Tiempo medio de primera respuesta
- Tiempo medio de resolución del ticket
- Tiempo medio de manipulación
Todos ellos serán específicos de la empresa, pero el hilo que los une a todos es la medición de la satisfacción del cliente. Éste es el único KPI que constituye una especie de línea de base, y por tanto es crítico para cualquier empresa, independientemente de cualquier otro factor.
¿Qué métricas de la experiencia del cliente son importantes?
Veamos las métricas más cruciales de la experiencia del cliente que suelen medir las empresas. Hay muchas que son importantes, por supuesto, pero aquí hemos detallado las 11 métricas más importantes a cuya medición las empresas dedican más tiempo y esfuerzo.
1. Puntuación de satisfacción del cliente (CSAT)
La puntuación de satisfacción del cliente, también conocida en el sector como puntuación «CSAT», es quizá una de las métricas más importantes relacionadas con la experiencia del cliente. Las puntuaciones CSAT se determinan tras la resolución de un ticket mediante una encuesta en la que se pide al cliente que valore su experiencia de asistencia. Una puntuación CSAT global del 80% se considera buena según los estándares del sector.
Sin embargo, como con cualquier encuesta, querrás asegurarte de que basas tu puntuación en un tamaño de muestra saludable. En otras palabras, debes asegurarte de que rellena la encuesta el mayor número posible de clientes.
Es un hecho que los clientes insatisfechos tienden a dejar más reseñas que los clientes satisfechos. Por lo tanto, es esencial pedir a los que han tenido una buena experiencia que participen en encuestas sobre la experiencia del cliente para asegurarte de que tu puntuación es representativa de la experiencia general del cliente.
Otro factor crítico aquí es comparar tu puntuación CSAT mes a mes para ver cómo evoluciona a lo largo del año. Lo ideal es que la puntuación mensual se mantenga estable o aumente. Si la puntuación tiende a la baja en algún momento, debes examinar por qué, y si ha llegado el momento de invertir en formación adicional del equipo.
2. Volumen de entradas
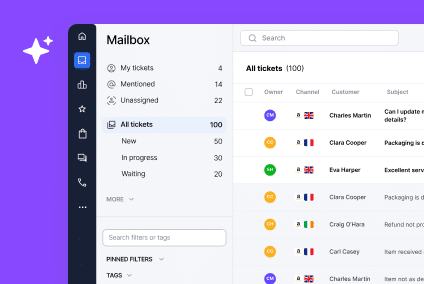
El volumen de tickets mide el número total de conversaciones en tu bandeja de entrada de soporte, para que puedas ver a cuántos clientes has ayudado en un periodo determinado. Puedes profundizar más para ver los tiempos de resolución de estas conversaciones, aunque la resolución es una métrica aparte, pero en general, este KPI te dará una visión de pájaro de cuánta ayuda necesitan tus clientes en un periodo determinado.
El volumen de entradas también te permite ver los picos de volumen de actividad. Por ejemplo, en los periodos de compras navideñas, puedes ver un mayor volumen de entradas. Tener esta información a mano te ayudará a planificar futuros picos de compras, posiblemente contratando ayuda estacional adicional para gestionar los periodos de mayor actividad.
Por último, las Reseñas sobre el volumen de tickets también pueden ser una señal de que ha llegado el momento de invertir en una base de conocimientos de autoservicio que tus clientes puedan utilizar para ayudarles a resolver sus propios problemas de forma independiente, sobre todo si ves que surgen las mismas consultas de tickets una y otra vez.
3. Atasco de entradas
La acumulación de tickets es la cantidad de solicitudes de atención al cliente que quedan sin resolver durante un periodo determinado. Los tickets sin resolver permanecen así por diferentes motivos:
- Bajo rendimiento del equipo
- Un volumen elevado que tu equipo tiene dificultades para gestionar
- Un alto volumen de cuestiones complejas que tardan más en resolverse
Hay que tener en cuenta que responder a un cliente no es lo mismo que resolver su problema. Debes asegurarte de que el número de resoluciones es igual o superior al número de conversaciones que un agente ha mantenido con el cliente.
Puedes mantenerte al tanto de los problemas no resueltos estableciendo recordatorios para hacer un seguimiento de las consultas y poniendo en marcha políticas según las cuales cada consulta abierta debe comprobarse en determinados plazos. Estas acciones pueden ayudar a agilizar el proceso y reducir la acumulación de incidencias, que siempre es el objetivo.
4. Tiempo medio de resolución
El tiempo medio de resolución es precisamente eso: el tiempo que se tarda en resolver completamente el problema de un cliente. De nuevo, una respuesta no es lo mismo que una resolución, así que el hecho de que tu equipo se ponga en contacto con el cliente no significa que esté resolviendo el problema.
Tu tiempo medio de resolución reflejará si tu equipo está respondiendo más que resolviendo. Un tiempo de resolución más corto significa que los agentes de atención al cliente están dando respuestas más eficientes. Si tu tiempo de resolución es superior a la media (o superior a donde quieres que sea), puede que te des cuenta de que necesitas formar a tus equipos para que respondan mejor a los problemas, de forma que se consiga una mayor resolución.
Aquí es donde la base de conocimientos puede ser útil de nuevo. Además de resolver el problema del cliente, remitirle a tu base de conocimientos puede capacitarle para responder por sí mismo a preguntas adicionales, reduciendo así las consultas y ayudando a disminuir el tiempo medio de resolución.
5. Tiempo medio de respuesta

Tal como dice en la lata, el tiempo medio de respuesta es el tiempo que tarda un representante del servicio de atención al cliente en responder a una consulta de un cliente. El tiempo de respuesta es un factor clave para los clientes, que esperan respuestas rápidas a sus problemas.
Implementar el chat en vivo y las respuestas automáticas inmediatas puede, sin duda, ayudar con el tiempo de respuesta, pero también es importante que, además de esto, el cliente obtenga una respuesta inmediata de un agente en cuanto se reciba el ticket.
Si tus métricas te muestran que el tiempo medio de respuesta es inusualmente alto, puedes compararlo con el volumen de tickets e identificar patrones de horas punta, para los que puedes contratar personal adicional. Si añades más personal de apoyo en los momentos en que sabes que habrá más trabajo, el tiempo medio de respuesta bajará y tus clientes estarán más contentos de recibir una respuesta más rápida.
Relacionado: 5 formas de reducir el tiempo de respuesta al cliente
6. Tasa de resolución en el primer contacto
La tasa de resolución en el primer contacto es el porcentaje del total de tickets en los que resuelves completamente una consulta con una sola respuesta. Obviamente, quieres que esta cifra sea lo más alta posible, porque significa que tu equipo está bien formado y que tus procesos funcionan correctamente.
En teoría, sin embargo, mantener un alto índice de resolución en el primer contacto puede ser un poco complicado. Puede ocurrir que se necesite información adicional o que los clientes tengan preguntas de seguimiento. Todo esto lleva a mensajes adicionales de ida y vuelta, lo que aleja la interacción de la resolución que se consigue en el primer contacto.
Sin embargo, puedes trabajar con tus equipos para mejorar la tasa de resolución en el primer contacto. Puede ser útil que tu equipo utilice una base de datos de respuestas probadas, ya que se ha comprobado que son eficaces para resolver rápidamente los problemas de los clientes. Además, la base de conocimientos puede ser beneficiosa para que los clientes eviten largos mensajes de ida y vuelta con múltiples pequeñas consultas.
7. Respuestas por resolución
Las respuestas por resolución te muestran con qué frecuencia un agente y un cliente van y vienen antes de llegar a una solución. Una vez más, debes capacitar a tus equipos para garantizar que esta cifra se mantenga baja. Cuanto más baja sea, más eficaz será tu equipo a la hora de resolver los problemas de los clientes.
Esta métrica también puede ser útil para señalar problemas relacionados con nuevos productos o cambios en la empresa. Puede haber una razón por la que las respuestas por resolución hayan aumentado repentinamente en tus equipos. Comprender esto te ayudará a planificar futuros lanzamientos de productos o a identificar problemas de productos que también pueden ser útiles para otros equipos de la organización.
8. Puntuación del promotor neto (NPS)
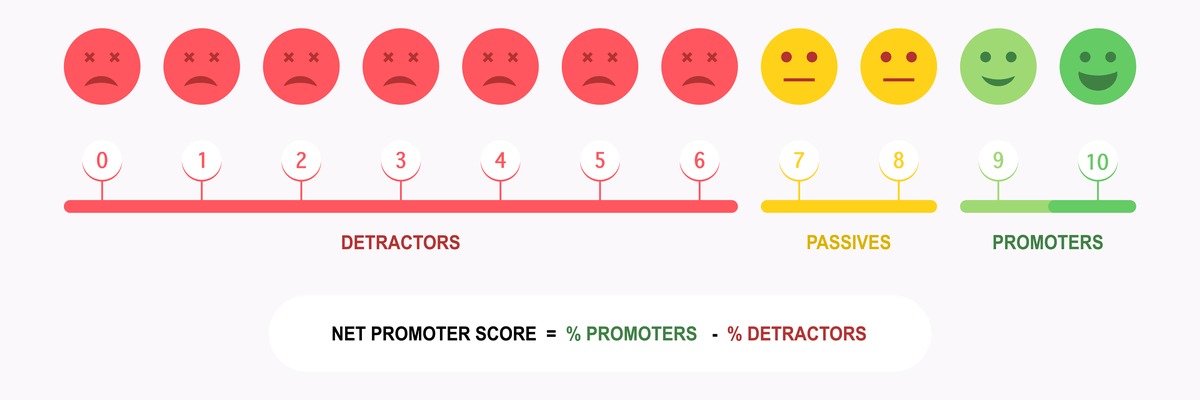
Las recomendaciones de los clientes son una de las formas más importantes de aumentar tu negocio. La puntuación neta de promotores (NPS) mide la probabilidad de que tus clientes recomienden tu producto o servicio. Puedes identificar tu puntuación NPS enviando a cada cliente una breve encuesta en la que se le pida que califique de cero a diez su grado de satisfacción con tu empresa y si recomendaría hacer negocios con ella a un amigo o colega.
Tu NPS puede variar, por lo que es bueno establecer una línea de base a partir de la cual medir. Después, puedes correlacionar todo lo que hace tu equipo de atención al cliente con el NPS. La puntuación podrá decirte, a grandes rasgos, si el programa de experiencia del cliente que has desarrollado, y cómo lo has aplicado, están funcionando para alcanzar el objetivo de lograr la satisfacción y fidelidad del cliente.
9. Valoración de la experiencia del cliente
La valoración de la experiencia del cliente puede darte una idea de cómo le ha parecido a tu cliente su experiencia general con tu empresa, desde la compra hasta la ayuda y el seguimiento. A veces, este Feedback puede ir un poco más allá, y los clientes pueden hacer comentarios sobre el tono, los modales y la disposición a ayudar de un agente. Aunque estos factores son subjetivos, obtener este feedback de tus clientes puede informarte sobre cómo se sienten en general sobre sus interacciones y su experiencia general con tu empresa.
Esta métrica es útil porque puede ayudarte a determinar si necesitas aumentar tus esfuerzos de atención al cliente, hacer ajustes para mejorar las tasas de retención de clientes o incluso ver si existe la oportunidad de hacer ventas adicionales o cruzadas a tus clientes.
Así que, aunque la experiencia del cliente parezca muy subjetiva, es una métrica importante y no debe descartarse en absoluto.
10. Tasa de rotación
Tasa de rotación: ¡ay, duele hasta escribir esas palabras! Evidentemente, nadie quiere que se produzcan bajas. Sin embargo, por doloroso que sea, es una métrica importante a la que prestar atención, porque puede darte una orientación clara sobre cómo y dónde tienes que mejorar tu experiencia de cliente.
En pocas palabras, la tasa de rotación te muestra qué porcentaje de clientes abandona tu empresa o marca tras unas pocas interacciones satisfactorias. Duele perder clientes, pero es importante saber por qué.
Siempre se espera un cierto nivel de rotación, pero si tu tasa de rotación parece alta o se dispara en determinadas épocas del año, es probable que se puedan hacer mejoras para evitarla y reducirla.
11. Tasa de retención de clientes
Las investigaciones demuestran que retener a los clientes existentes es 5 veces más rentable que encontrar nuevos clientes. Esta es una razón clave por la que vigilar de cerca la información relativa a las tasas de retención de clientes es importante para la salud de tu negocio en general.
En términos de experiencia del cliente, una mayor tasa de retención de clientes significa que tus equipos lo están haciendo bien, y que sus esfuerzos se traducen en clientes más satisfechos y dispuestos a volver a comprar en tu empresa. También significa que vas por buen camino con la formación de tu equipo de atención al cliente y la aplicación del programa. Todas las empresas deberían aspirar a un alto índice de retención, y la experiencia del cliente es una forma clave de conseguirlo.
Reflexiones finales
Aunque las métricas de experiencia del cliente por sí solas no mejorarán tu experiencia del cliente, las perspectivas que proporcionan te permiten tomar mejores decisiones para mejorar tu programa de experiencia del cliente.
Si te mantienes al tanto de tus KPI de experiencia del cliente y actúas en función de lo que te enseñan, pronto descubrirás que estás superando con creces los objetivos que te has fijado para tu empresa. Mejorar la experiencia del cliente ofrece un beneficio empresarial tangible a todas y cada una de las partes de tu empresa.
El software de servicio de asistencia para comercio electrónico de eDesk puede ayudar a tu negocio online a mejorar las métricas de experiencia del cliente resolviendo los problemas de los clientes más rápidamente. Reserva una demostración para obtener más información o inicia hoy mismo una prueba gratuita de 14 días (sin necesidad de tarjeta de crédito).